BTC Facing Huge Resistance, Rejection Can Result in $18K Retest (Bitcoin Price Analysis)
Cryptocurrency
Over the past week, Bitcoin had been fluctuating around the $20k confluence zone showing no real signs of a possible rebound: low volatility, lack of demand, and choppy price action. After retesting the primary demand zone at $18K, the price temporarily rebounded toward the $22K resistance level but quickly got rejected.
Cryptocurrency Technical Analysis
Technical Analysis By Shayan
The Daily Chart
The following chart shows that BTC had formed a continuation correction pattern following the sharp decline. If the price succeeds in breaking to the bullish side, a rally becomes likely, toward the $30K – the first major resistance.
From the bullish side, the $30K level and the 50-day and 100-day moving averages are the main barriers blocking Bitcoin’s potential to reverse the negative trend and start the next substantial bull run.
In contrast, if the price breaks to the downside – a cascade to the $15-16K region will be the most probable scenario. Meanwhile, the RSI indicator also hints at the relative equilibrium between the bulls and bears, which adds to the indecisive situation.
The 4-Hour Chart
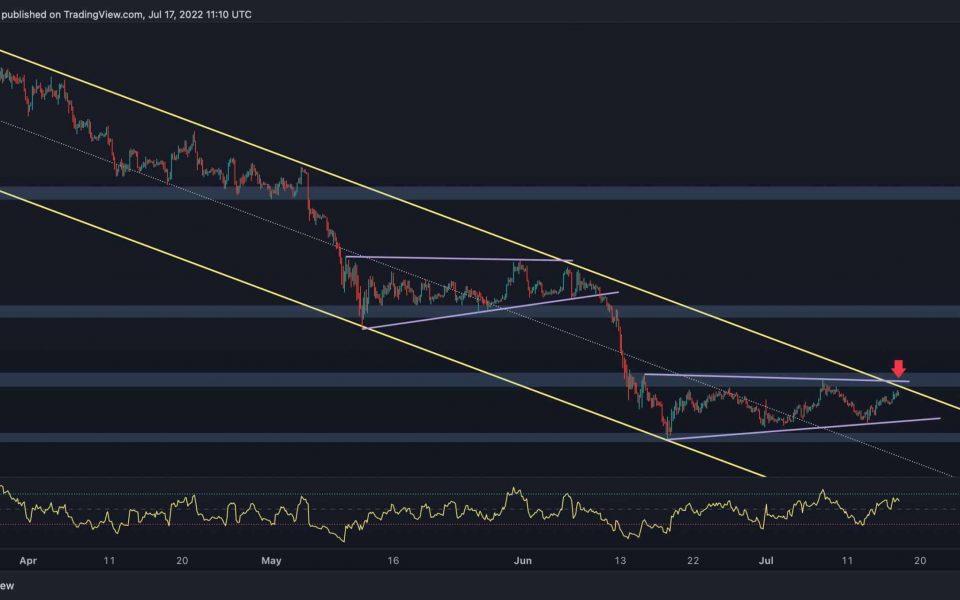
Bitcoin has been plummeting inside a sharp descending channel since April. After testing the lower boundary for the third time, the price has entered a mid-term consolidation stage forming a bearish wedge, which is a continuation pattern.
The price recently found support at the lower trendline (marked purple) and then spiked towards the channel’s upper boundary and the bearish wedges’ upper trendline.
If the trendline rejects the price, a new short-term plunge towards the $18K mark becomes likely. In contrast, if the price breaks above the descending trendline and the wedge pattern to the upside, Bitcoin’s next target will be the $30K significant resistance level.
Given the overall financial markets’ uncertainty and the current bearish sentiment in the crypto market, a new bearish leg is the most probable scenario.
Cryptocurrency On-chain Analysis
Onchain Analysis By: Edris
Bitcoin Miners Reserve
Bitcoin’s price has been consolidating at the $20K level for the past few weeks. The Miners Reserve chart shows that the miners have been distributing their funds.
According to data aggregator CryptoQuant, the miners have offloaded the most significant amount of Bitcoin since January 2021 during the last couple of weeks. They are under a lot of pressure because of the diminishing profitability.
These miners were forced to sell their Bitcoin at market price to minimize losses and lower their overall risk. Consequently, if this situation continues, the selling pressure caused by forced sellers could push the price even lower in the short term, dropping well below the $20K mark.
Binance Free $100 (Exclusive): Use this link to register and receive $100 free and 10% off fees on Binance Futures first month (terms).
PrimeXBT Special Offer: Use this link to register & enter POTATO50 code to receive up to $7,000 on your deposits.
Disclaimer: Information found on CryptoPotato is those of writers quoted. It does not represent the opinions of CryptoPotato on whether to buy, sell, or hold any investments. You are advised to conduct your own research before making any investment decisions. Use provided information at your own risk. See Disclaimer for more information.
Cryptocurrency charts by TradingView.
